Why data is the new oil of the digital economy?
In 2006, British mathematician and Tesco marketing mastermind Clive Humby shouted from the rooftops, “Data is the new oil.” For the next 15 years, big tech like Facebook and Google scooped incalculable data to fascinate us with as much unfiltered information as possible. Their business models quickly turned toward becoming the largest attention merchants in the world. There is more data being captured about everything than ever before. Clive Humby coined the phrase: “Data is the new oil” and just like oil before, data is shaping the new world.
Data science is the field of study that combines domain expertise, programming skills, and knowledge of mathematics and statistics to extract meaningful insights from data. For companies, data science is a significant resource for making data-driven decisions since it describes the collecting, saving, sorting, and evaluating data.
Highly experienced computer experts frequently employ it. When we ask ourselves why data science is essential, the answer rests because the value of data continues to increase. Data science is in great demand because it demonstrates how digital data alters organizations and enables them to make more informed and essential choices.
Data science can be found just about anywhere these days. That includes online transactions like Amazon purchases, social media feeds like Facebook/Instagram, Netflix recommendations, and even the finger and facial recognition capabilities given by smartphones.
Data Science covers numerous cutting-edge technological ideas, such as Artificial Intelligence, the Internet of Things (IoT), and Deep Learning, to mention a few. Data science’s effect has grown dramatically due to its advancements and technical advancements, expanding its scope. By learning Data science, you can choose your job profile from many options, and most of these jobs are well paying. A few of these job profiles are Data Analyst, Data Scientist, Data Engineer, Machine Learning Scientist and Engineer, Business Intelligence Developer, Data Architect, Statistician, etc.
Today data is everywhere in every field. Whether you are a data scientist, marketer, businessman, data analyst, researcher, or you are in any other profession, you need to play or experiment with raw or structured data. Data has become an important asset for an organization.
Data can be quantitative or qualitative:
Here are examples of sources of quantitative and qualitative data:
QUANTITATIVE DATA SOURCES | QUALITATIVE DATA SOURCES |
Program information – numbers involved, what happens when, who it is for, cost, participation levels. | Getting feedback on a program – weekly check-ins, surveys, groups discussions, before-and-after program questions. |
Statistics and statutory data. | Stories of participants’ experience and impact. |
Environmental monitoring such as bird counts, seeds planted and fish stocks. | Observation of a program. |
Structured surveys involving multiple-choice, rating scales or other closed questions. | Document review such as literature reviews. |
Control groups – comparing one group that experienced a program with another similar group that did not. | Interviews involving open-ended questions with backers, service providers and participants. |
Recording transactions, such as website hits. | Visual methods such as photos, DVDs and art or participants’ creative works. |
The ability to anticipate the future is critical in today’s fast moving economy with data being created. It didn’t ever increasing rate. There were some companies able to separate the signal from the noise. It starts with the principles of data and analytics. You’ve collected data and framed a problem. So now it’s time to put that data to work, to find a solution to do so. We must venture a guess about what factors have the greatest influence on the problem. A model is this statistical representation of this guess. Basically, you’re taking your data. You’re creating a hypothesis for what aspects of your data are really important predictors of the outcome that you want to explain. And then you give it a shot.
Believe it or not. These educated guesses are all around us, behind your weather forecast, your Instagram feed or restaurant recommendation. There’s a model. And behind every model, there’s a team and understanding of your industry, customer and business model are vital to identifying the various factors, shaping a problem and how they interact.
We thought of analysts only in terms of professional analysts, you know, people with highly quantitative backgrounds and so on, but now organizations have matured a bit. They realize the importance of translators between the business side and the quantitative side. People who are able to translate between the technical needs of an analytical project and the business need the needs of customers. They need some employees in order to make that solution work well and be easily deployed in day-to-day context.
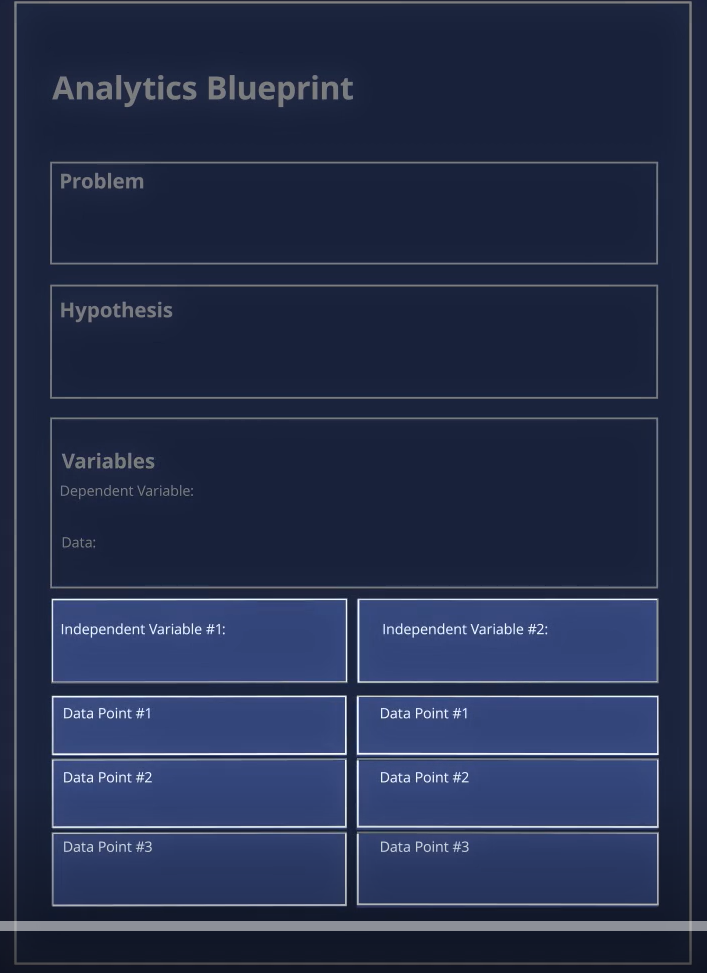
Well, data scientists will develop the technical piping of a model. Their work is informed by input from colleagues with intimate knowledge of the problem space. And this process is not unlike an architect who works with designers, construction workers, landscapers, and owners, to draft a home, a certain framework. Then for translating your contextual knowledge in an analytical way, is the analytics blueprint, a template deconstructing the model into distinct parts domain experts can advise on starting with the problem you’d like to analyze this problem will inform a hypothesis, an educated guess about what factors influence your problem.
Draw a hypothesis out of the air, in a way that’s true because it is a guess about what’s going on in your data. And the cool thing about analytics is we, we prove it or disprove it.
Where will this far too complicated to test all the possible reasons why an event takes place a hypothesis guides us toward reliable findings by narrowing our analysis on an educated guess that a model can confirm or refute.
As an example, say, you’re in a telecom company and you want to keep those customers paying their high bills every month. And so you might think about, well, what might cause attrition?
So your problem would be what are the leading factors that cause our key clients to leave now use that to formulate a hypothesis.
So you said, well, um, maybe a number of recent line drops could make customers unhappy, maybe a family plan. You know, I would love to change my, um, my telecom plan, but my kids are on it. My wife is on it. So I was just saying, how well do I have to get an order to get my kids off the family plan? Maybe I need some predictive analytics about that.
Competence hypothesis is that line jobs and telecom plan types influenced customers, leaving their contracts. Before you start designing the rest of your model, refine your hypothesis to ensure the results of your model can validate or refute your hypothesis. Strong hypothesis have two characteristics they’re specific and falsifiable first specific hypotheses clearly indicate what combination of factors influence an outcome. Our telecom hypothesis is not that I could align jobs or plan type effect attrition, but that both affect attrition.
Second, make your hypothesis falsifiable, meaning it can be confirmed or refuted. You want to be as clear as possible about what you’re trying to learn. In our example, we can improve our first hypothesis to line jobs in the DC area, lead DC customers to leave their contract and our second hypothesis to not being on a family plan, influences DC customers to leave their contract. Once you’ve got your hypothesis, think about which measurable factors you have available to confirm or refute your hypothesis.
These specific factors are called variables. There are different types of variables. And the most important distinction is between an independent variable and a dependent variable. The dependent variable is the variable that we’re trying to predict or explain. It’s the outcome variable. And then independent variables are the ones that we use to try to predict or explain the dependent variable. If we’re doing a good job with our model, the independent variables predict or explain the majority of the variation in that dependent variable.
Keeping with the telecom example, the dependent variable is customers leaving their contracts and the independent variables are line jobs in a specific area and the type of plan a customer subscribes to. Now that we know these variables, we can assign several pieces of data to each variable customer attrition rate measures. How many customers leave their contracts? The first independent variable line jobs can be measured by number of jobs, calls, timing of drops calls, or number of dropped calls with high signal level. This second independent variable, a customer’s plan type can be measured by specific data.
So it’s just how many devices are on the family plan. And how many years has the family been on the plan or take recruiting? Imagine trying to predict something as subjective as the attributes of a strong, higher right.
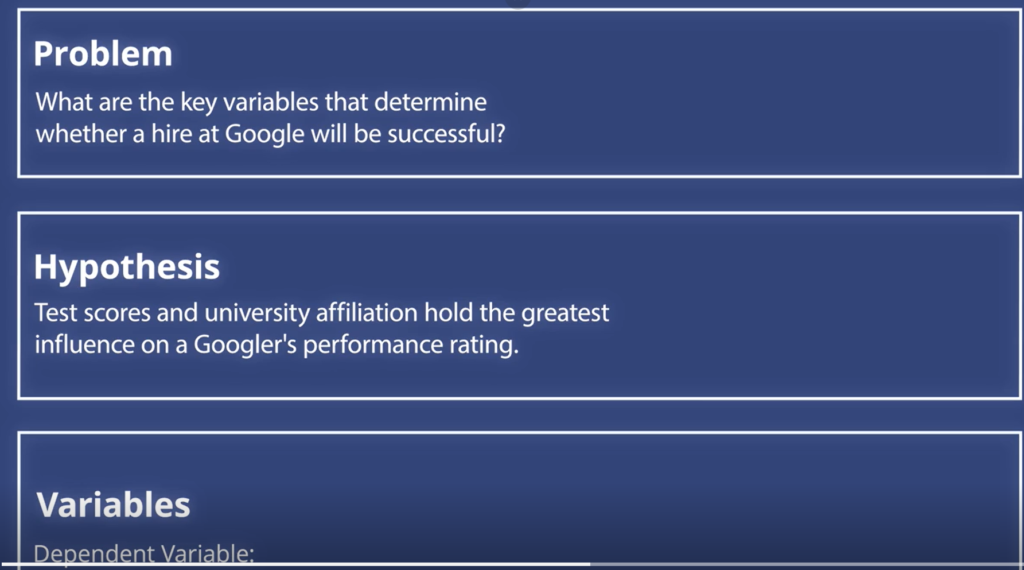
Process of trying to predict what makes for a good employee hire. This is something that Google was well-known for a dependent variable is the performance review itself who gets a really high rating in their performance review. Then you start thinking about, well, what variables might predict a really high performer,.
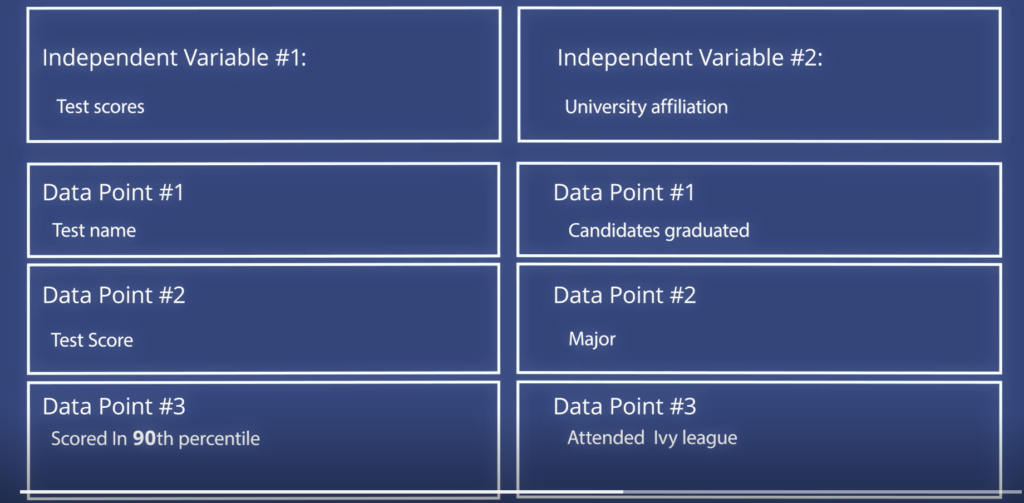
The case of Google, the firm frames, the problem as what are the key variables is that determined whether a hire at Google will be successful. Google recruiters, hypothesized that test scores and university affiliation held the greatest influence on a Googler’s performance rating. This means that Google identified a high-risk performance rating as the dependent variable test scores and university affiliation where they’re independent variables to measure test scores. Google could evaluate data such as testing test score itself.
And whether the score falls into the 90th percentile for university affiliation, it could be if Canada’s graduated their major and whether the university is in the Ivy league, most data falls into one of four categories, order from least process the most precise they are binary, categorical, ordinal, and numerical first binary, the least precise data category, binary data measures, things that can be answered with a yes or no question.
The simplest form of variable is just binary. Uh, do you have a car or not? Did you vote in the last election or not? Um, often in statistical models, these are just re represented representatives. If you, if you’re yes. On that, you’re you to won. If you don’t get a zero,.
The more precise is categorical data. As the name suggests categorical data organizes data into labeled groups, categorical data, it’s more difficult to process them binary data, but offers more precision.
Your race or ethnicity. Maybe the variable is geography. And you’re trying to say, what county are you from? Or what state are you from? Those are categorical. Next ordinal data. These provide more precision than categorical data because they let you give responses to categories on a numerical scale. Ordinal data is a popular way to capture attributes like the quality of Airbnb along the five-star scale.


You probably seen these a lot where you disagree strongly disagree, somewhat neutral, uh, agree, somewhat, uh, strongly agree. That’s known as a liquored scale after Mr. Liquor who developed it, it’s used a lot because it shows greater or lesser degrees of, um, agreement with a particular.
Numerical data is the most precise in our network example, both attrition rate and number of devices on a family plan or numerical data. When you have a chance to collect and use these data points record with as much granularity as possible.
The numerical variable is the most valuable of all that is, you know, something like age or income. It has a lot of precision. So don’t categorize age as 10 to 20, uh, 21 to 30 and center up, um, leave it as the original age. And that tends to have more predictive power in your, in your models.
It’s always more precise and easier to analyze numerical data. So make use of it when possible that completes your analytical blueprint. Well, data scientists develop more technical blueprints to build a working model.
Your blueprint provides a valuable jumping off point. So be sure to share it with the data team, for companies looking to design models, that unlock insights. There are a few key takeaways. First hypothesis are educated guesses that have underlying assumptions keep an open mind and solicit input from throughout the business.
All making assumptions and those assumptions are based on our kind of mental model of what we think is driving the outcome we care about. So it’s very important with analytics in general, to keep an open mind. It’s often a good idea to take the variables that you have hypothesized are going to be important and run them by the people who are familiar with the business problem. Talk to some other people, you know, what factors might influence this particular outcome that we’re trying to predict or understand and chances are high that you come up with a reasonable model. Second, whereas machine learning can process may variables, traditional analytics runs better with fewer variables. Third, evaluate data complexity when designing a model – when in doubt, keep it simple.